Instructions
Requirements and Specifications
Source Code
CP SILVER
% specific heat of silver in j/mole-K
% from VJ Johnson, Properties of Materials at Low Temperature
%
Data = [
.001 0.0
1.35 0.00106
2 0.00262
3 0.00657
4 0.0127
5 0.0213
6 0.0373
7 0.0632
8 0.0987
10 0.199
12 0.347
14 0.559
16 0.845
20 1.67
25 3.10
30 4.77
40 8.41
50 11.65
60 14.35
70 16.29
80 17.91
90 19.09
100 20.17
120 21.57
140 22.54
160 23.30
180 23.84
200 24.3
220 24.6
240 24.9
260 25.2
280 25.3
298 25.35 ];
%
Temp = Data(:,1);
Cp = Data(:,2);
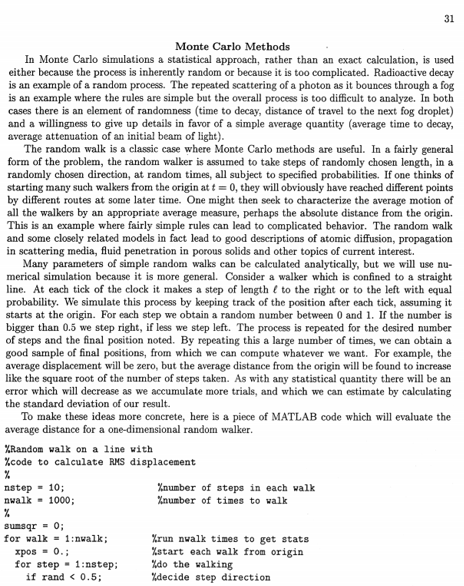
MONTE CARLO
clc, clear all, close all
%% part A)
% Define number of steps
steps = 100;
% Define size of grid
sizex = 100;
sizey = 100;
x(1) = 0; % Starting x-position
y(1) = 0; % Starting y-position
% Define possible movements
movements = [1, 0; % right
-1, 0; % left
0, 1; % down
0, -1; % up
1, 1; % right and down
1, -1; % right and top
-1, 1; % left and down
-1, -1]; % left and top
sumsqr = 0;
for i = 2:steps
% Select random movement
m = movements(randperm(8,1), :);
x(i) = x(i-1) + m(1);
y(i) = y(i-1) + m(2);
if x(i) < -sizex/2
x(i) = -sizex/2;
elseif x(i) > sizex/2
x(i) = sizex/2;
end
if y(i) < -sizey/2
y(i) = -sizey/2;
elseif y(i) > sizey/2
y(i) = sizey/2;
end
sumsqr = sumsqr + x(i)^2 + y(i)^2;
end
% Now, plot
figure
scatter(x, y)
grid on
xlim([-sizex/2, sizex/2]);
ylim([-sizey/2, sizey/2]);
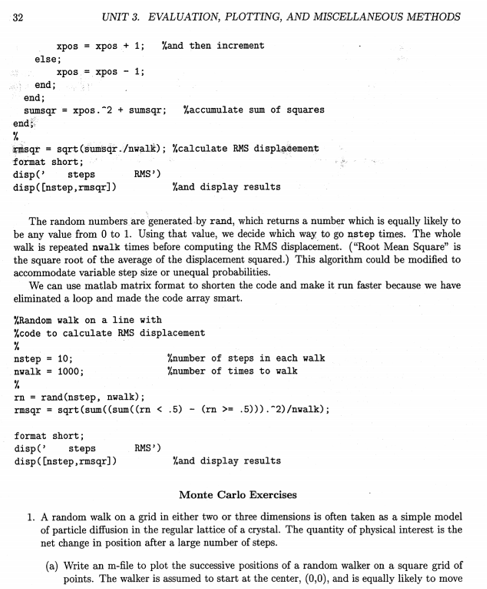
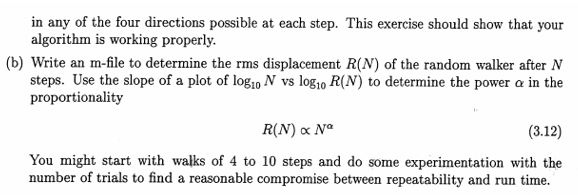
%% Part B)
N = steps;
R = sqrt(sumsqr/N);
% Calculate R(N) as a function of each value (x,y)
Rv = sqrt((x.^2 + y.^2)./N);
Rv = Rv(2:end);
% Show the plot of log10(N) vs log10(R(N))
figure
x2 = log10(2:N);
y2 = log10(Rv);
m = (y2(end)-y2(1))/(x2(end)-x2(1))
plot(log10(2:N), log10(Rv))
hold on
plot(x2, y2(1) + m.*(x2-x2(1)), 'r--', 'linewidth', 2)
grid on
fprintf("The slope is m = %.4f\n", m);
QUESTION 1
clc, clear all, close all
%% Part a)
% For this part, see the file trapezoidal.m
%% Part b)
% We load the values of cp_silver
cp_silver;
a = 0.01;
b = 298; % value of T
% The tabulated function is Cp/T
f = Cp./Temp;
% Solve
S = trapezoidal(f, a, b)
% We see that the value does not match the expected one, but it is because
% the values of temp are not equally spaced
QUESTION 2
clc, clear all, close all
global T
%% Part a)
Tvals = [100, 200, 300, 2500];
Pvals = zeros(1, length(Tvals));
figure
hold on
legends = {};
for i = 1:length(Tvals)
T = Tvals(i);
% Define vector of E
E = linspace(0, 100, 1000);
plot(E, P(E))
legends{i} = sprintf("T = %d K", T);
end
legend(legends);
xlabel('E')
ylabel('P(E)');
grid on
%% Part b)
% For this part, we will start with an initial value of Emax and
% calculate the value of P(E). We will increase Emax until the value
% of P(E) is closer enough to 1.0.
Emin = 0;
Emax = 1;
T = 2500; % Temperature
tol = 1e-5; % Minimum error between P(E) and 1.0
% Increate Emax until the value of the fraction 1e-5 closer to 1
err = Inf; %Initial error
while err > tol
frac = quad(@P, Emin, Emax);
err = abs(frac-1); % Calculate error
Emax = Emax + 1; % Increase Emax
end
Emax = Emax - 1; % we decrease 1 because in the last iteration, even when the tolerance is met, the value of Emax is increased
%% Part c)
Emax = 35740;
% Define the new function as E*P
f = @(E)(E.*P(E));
% Now, define the different values of T
Tvals = [100, 300, 2500];
% For each T, calculate
for i = 1:length(Tvals)
T = Tvals(i);
Eavg = quad(f, 0, Emax);
fprintf("The average kinetic energy for T = %d K is %.4f K\n", T, Eavg);
end
%% Part d)
% The Maxwell-Boltzmann Distribution is the function P(E)
Eact = 3500;
% Define the values of T
Tvals = 100:10:2500;
for i = 1:length(Tvals)
T = Tvals(i);
% compute the fraction
p(i) = quad(@P, 0, Eact);
Eavg(i) = quad(f, 0, Emax);
end
% Now, we plot the fractions vs Energy
figure
plot(Eavg, p), grid on
xlabel('Average Kinetic Energy (K)')
ylabel('Fraction of molecules')
% From the graph, we see that the fraction is around 0.6009
A = 0.6009;
%% Part e)
k = A*exp(-Eact./Tvals);
% Transform to log scale
x = 1./Tvals;
y = log(A) - Eact.*x;
% x = log(A) - Eact./Tvals;
figure
plot(x,y), grid on
xlabel('lnA - Eact/T')
ylabel('lnk')
% It does seems to follow the law, because the Arrhemius plot should be
% a straight line with negative slope, and that is what we obtained
%% Part f)
% let's use polyfit
p = polyfit(x, y, 1);
% Extract slope
m = p(1);
fprintf("The slope obtained using polyfit is m = %.4f\n", m);
% We see that the slope matchs the exact value of the activation energy
TRAPEZOIDAL
function y = trapezoidal(f, a, b)
% This function integrates a function f, between a and b, using
% Trapezoidal method
% The number of points is equal to the length of f
n = length(f);
% Calculate Step
h = (b-a)/n;
% Solve
y = f(1);
for i = 2:n-1
y = y + 2*f(i);
end
y = y + f(end);
y = y*h/2;
end