Instructions
Requirements and Specifications
Source Code
clc, clear all, close all
%% First, load the signal
load ecg_person_1.mat
% Store the signal in a variable named 'y'
y = ecg_person_1;
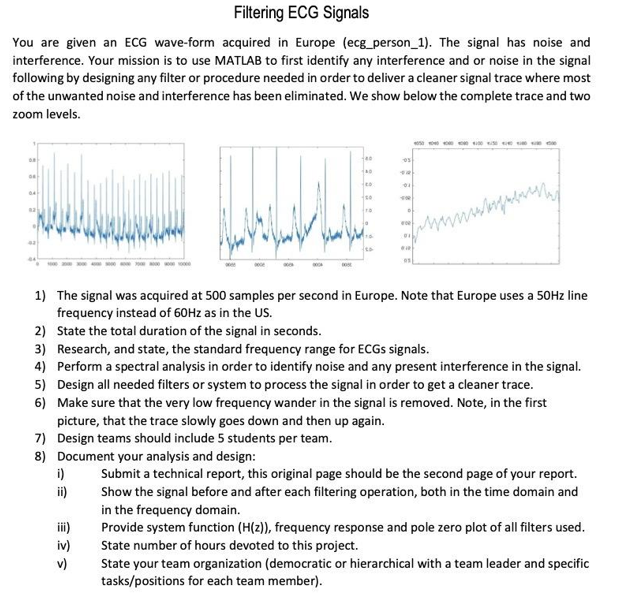
% Plot signal
figure(1)
plot(tm, y)
xlabel('Time (s)')
ylabel('Magnitude')
grid on
%% Question 2: Get duration of signal
% We were told that the signal is recorded with 500 samples per second so
% to get the total duration of the signal we just need to divide the total
% number of samples by 500
Tf = length(y)/500;
fprintf("The signal has a duration of %.2f seconds\n", Tf);
%% Question 3: Standard frequency
% The standard frequencty of ECG signals can vary between 0.5Hz to 100 or
% 150 Hz [1]
%% Question 4: Spectral Analysis
% let's plot a frequency spectrum analysis to check the main frequency
% on the signal and see if there are other frequencies
% Frequency spectrum
% Time step
dt = tm(2)-tm(1);
% Sampling frequency
Fs = 1/dt;
% Fast Fourier Transform
Y = fft(ecg_person_1);
% Length of signal
L = length(ecg_person_1);
P2 = abs(Y/L);
P1 = P2(1:L/2+1);
P1(2:end-1) = 2*P1(2:end-1);
f = Fs*(0:(L/2))/L;
figure(2)
plot(f,P1)
title('Single-Sided Amplitude Spectrum of ECG Signal')
xlabel('Frequency (Hz)')
ylabel('Magnitude')
grid on
% From the graph, we can see that the main frequency on the signal is 50Hz.
% We can also note that the signal has a lot of low-frequencies noise, so
% we now know that we need to filter these low frequencies. We can also see
% that the signal has frequencies of 150 Hz. This kind of noise is caused
% by the muscles when reading the ECG signals, so we will apply a bandpass
% filter to keep only the frequencies near 50 Hz
%% Question 5: Design a bandpass filter to filter frequencies higher than 100 Hz
% First, we remove the trend from the signal. We assume a trend of a 4-th
% order polynomial. We assume this because after trial-and-error, this
% value returned a signal with the trend removed
yf = detrend(y,4);
% Now, we remove noise
yf = medfilt1(yf, 10);
% Now, we remove the low frequencies
[yf,d] = bandpass(yf, [20,70], Fs);
% Get transfer function
% Plot
figure(3)
plot(tm, y)
hold on
plot(tm, yf)
legend('Original', 'Filtered')
xlabel('Time (s)')
ylabel('Magnitude')
grid on
% Frequency spectrum of filteres signal
[b,a] = tf(d);
H = tf(b,a)
% Now, show Frequency Spectrum of the filtered signal
% Fft
Y = fft(yf);
P2 = abs(Y/L);
P1 = P2(1:L/2+1);
P1(2:end-1) = 2*P1(2:end-1);
f = Fs*(0:(L/2))/L;
figure(4)
plot(f,P1)
title('Single-Sided Amplitude Spectrum of Filtered Signal')
xlabel('Frequency (Hz)')
ylabel('Magnitude')
grid on
%% References
% [1] https://www.ncbi.nlm.nih.gov/pmc/articles/PMC4624499/#:~:text=Modern%20ECG%20machines%20record%20ECG,Hz%20as%20an%20industry%20standard.