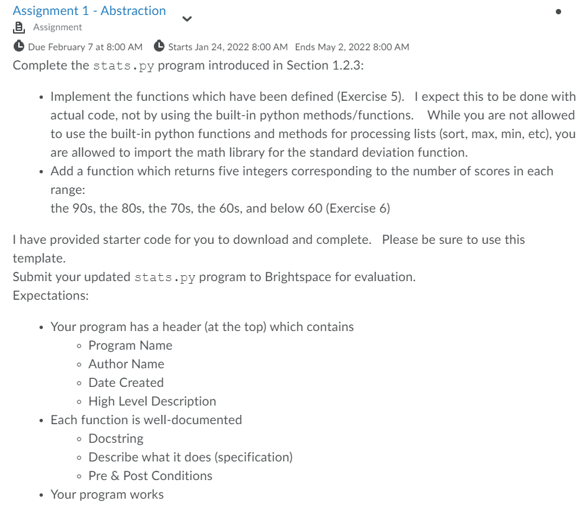
Instructions
Requirements and Specifications
Source Code
# Program: stats.py
# Author:
# Date:
#
# Assignment 1, Intro to Data Strtures
#
# Note: you may NOT use the built-in statistical functions
# min, max, sum, et. Instead, create your own code to
# calculate the answer.
#
# You may use math.sqrt when calculating the standard deviation
import math
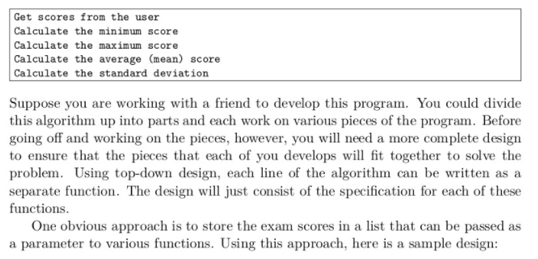
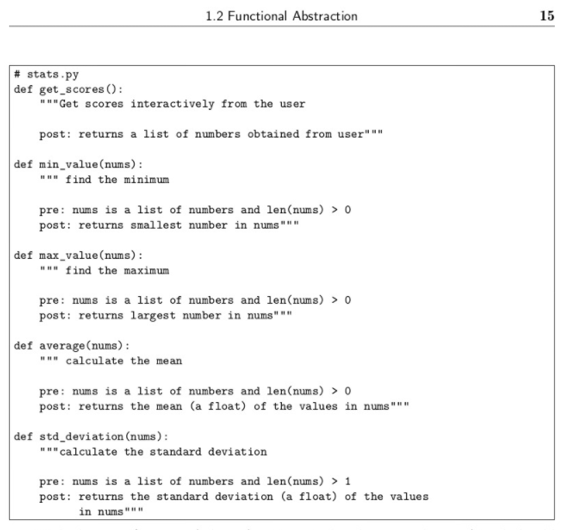
def get_scores():
'''Get scores interactively from the user
pre: None
post: returns a list of numbers obtained from user'''
nums = []
while True:
num = input("Enter a number ( to Quit): ")
if num == "": break
nums.append(eval(num))
return nums
def min_value(nums):
''' find the minimum
pre: nums is a list of numbers and len(nums) > 0
post: returns smallest number in nums'''
def max_value(nums):
''' find the maximum
pre: nums is a list of numbers and len(nums) > 0
post: returns largest number in nums
'''
def average(nums):
''' calculate the mean
pre: nums is a list of numbers and len(nums) > 0
post: returns the mean (a float) of the values in nums'''
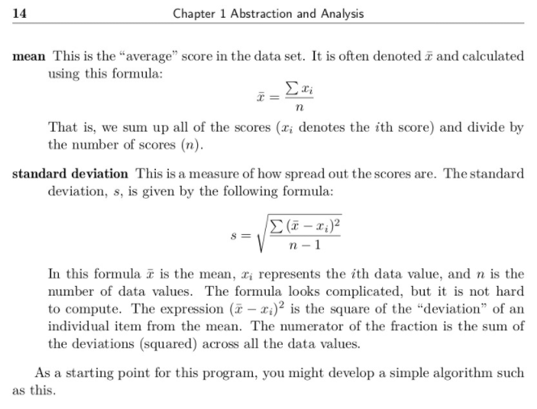
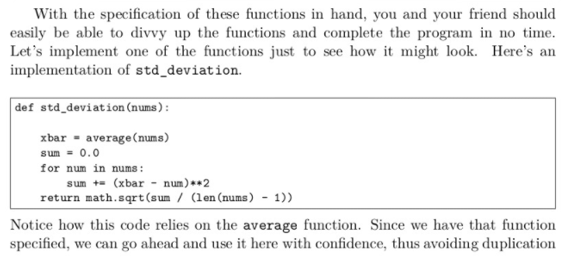
def std_deviation(nums):
'''calculate the standard deviation
pre: nums is a list of numbers and len(nums) > 1
post: returns the standard deviation (a float) of the values
in nums'''
def distribution(nums):
''' Document the pre & post conditions for this function '''
def main():
nums = get_scores()
print(min_value(nums))
print(max_value(nums))
print(average(nums))
print(std_deviation(nums))
print(distribution(nums))
if __name__ == '__main__':
main()