Instructions
Requirements and Specifications
Source Code
import random
import matplotlib.pyplot as plt
import numpy as np
import pandas as pd
import math
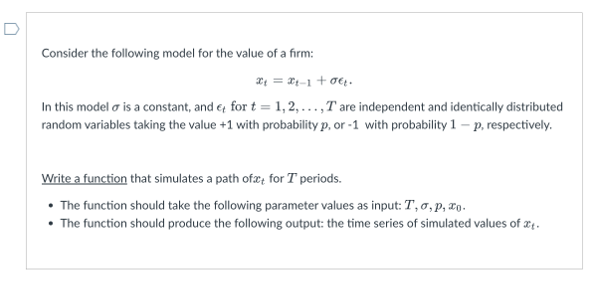
def Tpath(T, sigma, p, x0):
"""
QUESTION 1: Simulate the path of T
"""
# Create the list with the initial value
x = np.zeros(T+1)
# Now, simulate
for t in range(1,T+1):
# Generate epsilon
prob = random.uniform(0,1)
epsilon = 1 if prob <= p else -1
# Generate value
xt = x[t-1] + sigma*epsilon
# Append
x[t] = xt
# Return
return x
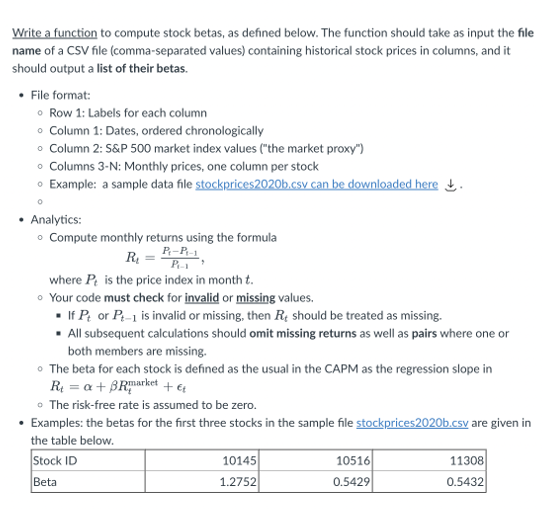
def stock_betas(filename):
# First, open file
data = pd.read_excel(filename, engine='openpyxl', skiprows = 1)
sp500 = data.iloc[:,1].to_numpy()
P = data.iloc[:,2:].to_numpy()
# Now for each stock calculate all RTs and beta
betas = []
for i in range(P.shape[1]):
prices = P[:,i]
x = []
y = []
xy = []
xx = []
# Calculate RTs
for t in range(1,len(prices)):
Pt = prices[t]
Ptold = prices[t-1]
if not math.isnan(Pt) and not math.isnan(Ptold) and Pt >= 0 and Ptold > 0:
Rt = (Pt-Ptold)/Ptold
y.append(Rt)
dsp500 = (sp500[t]-sp500[t-1])/sp500[t-1]
x.append(dsp500)
xy.append(Rt*dsp500)
xx.append(dsp500**2)
# Now calculate
beta = (len(x) * sum(xy) - sum(x) * sum(y)) / (len(x)*sum(xx) - sum(x) ** 2)
betas.append(beta)
return betas
if __name__ == '__main__':
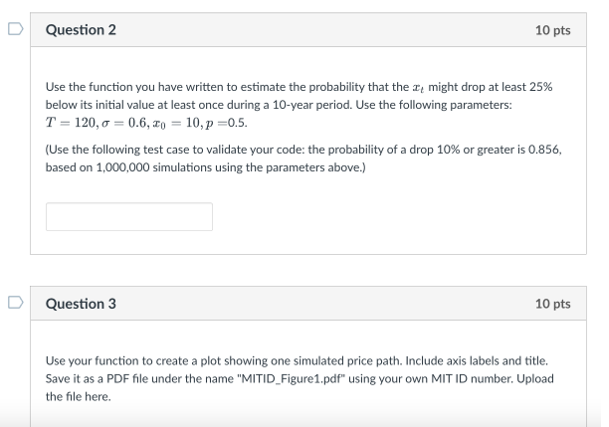
# Question 2
T = 120
sigma = 0.6
p = 0.5
x0 = 10
# Run the simulation of 1,000,000 cases
prob = 0.0
N = 10000
for _ in range(N):
x = Tpath(T, sigma, p, x0)
# Pick the number of times that x is less than x0
prob += len(np.where(x <= 0.75*x0)[0])/(T+1)
prob = prob/N
print("The probability that xt drops at least 25% below its initial value at least once is {:.4f}%".format(prob*100.0))
""" Question 3 """
# generate a new path
x = Tpath(T, sigma, p, x0)
plt.figure()
plt.plot(range(T+1), x)
plt.xlabel('Time (month)')
plt.ylabel('Probability')
plt.title('Probability vs. Time')
plt.grid(True)
plt.show()
""" Question 4 """
betas = stock_betas('stockprices2020b.xlsx')
print(betas)