Instructions
Objective
Write a python program to implement model fitting.
Requirements and Specifications

Source Code
!pip install otter-grader

# Initialize Otter

import otter

grader = otter.Notebook("lab8.ipynb")

# Lab 8: Fitting Models to Data

In this lab, you will practice using a numerical optimization package `cvxpy` to compute solutions to optimization problems. The example we will use is a linear fit and a quadratic fit.

import pandas as pd

import numpy as np

%matplotlib inline

import matplotlib.pyplot as plt

import seaborn as sns

## Objectives for Lab 8:

Models and fitting models to data is a common task in data science. In this lab, you will practice fitting models to data. The models you will fit are:

* Linear fit

* Normal distribution

## Boston Housing Dataset

from sklearn.datasets import load_boston

boston_dataset = load_boston()

print(boston_dataset['DESCR'])

housing = pd.DataFrame(boston_dataset['data'], columns=boston_dataset['feature_names'])

housing['MEDV'] = boston_dataset['target']

housing.head()

fig, ax = plt.subplots(figsize=(10, 7))

sns.scatterplot(x='LSTAT', y='MEDV', data=housing)

plt.show()

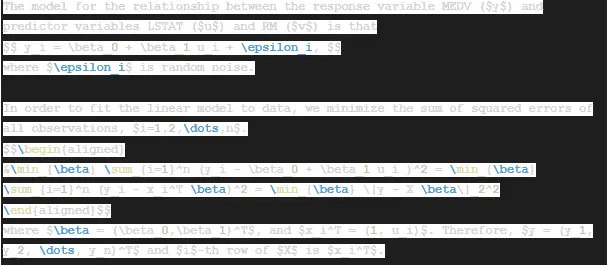
The model for the relationship between the response variable MEDV ($y$) and predictor variables LSTAT ($u$) and RM ($v$) is that

$$ y_i = \beta_0 + \beta_1 u_i + \epsilon_i, $$

where $\epsilon_i$ is random noise.

In order to fit the linear model to data, we minimize the sum of squared errors of all observations, $i=1,2,\dots,n$.

$$\begin{aligned}

&\min_{\beta} \sum_{i=1}^n (y_i - \beta_0 + \beta_1 u_i )^2 = \min_{\beta} \sum_{i=1}^n (y_i - x_i^T \beta)^2 = \min_{\beta} \|y - X \beta\|_2^2

\end{aligned}$$

where $\beta = (\beta_0,\beta_1)^T$, and $x_i^T = (1, u_i)$. Therefore, $y = (y_1, y_2, \dots, y_n)^T$ and $i$-th row of $X$ is $x_i^T$.

## Question 1: Constructing Data Variables

Define $y$ and $X$ from `housing` data.

y = housing['MEDV']

X1 = housing['LSTAT'].to_frame()

X1.insert(0, 'intercept', np.ones((len(y),1)))

#X.insert(0, 'intercept', X1)

grader.check("q1")

## Installing CVXPY

First, install `cvxpy` package by running the following bash command:

!pip install cvxpy

## Question 2: Fitting Linear Model to Data

Read this example of how cvxpy problem is setup and solved: https://www.cvxpy.org/examples/basic/least_squares.html

The usage of cvxpy parallels our conceptual understanding of components in an optimization problem:

* `beta` are the variables $\beta$

* `loss` is sum of squared errors

* `prob` minimizes the loss by choosing $\beta$

Make sure to extract the data array of data frames (or series) by using `values`: e.g., `X.values`

beta2

import cvxpy as cp

beta2 = cp.Variable(2)

loss2 = cp.sum_squares(y.values-X1.values @ beta2)

prob2 = cp.Problem(cp.Minimize(loss2))

prob2.solve()

yhat2 = X1.values@beta2.value

grader.check("q2")

## Question 3: Visualizing resulting Linear Fit

Visualize fitted model by plotting `LSTAT` by `MEDV`.

fig, ax = plt.subplots(figsize=(10, 7))

sns.scatterplot(x='LSTAT', y='MEDV', data=housing, ax = ax, label='Data')

sns.scatterplot(housing['LSTAT'], yhat2, label='Fit', ax = ax)

plt.legend()

plt.show()

## Question 4: Fitting Quadratic Model to Data

Add a column of squared `LSTAT` values to `X`. The new model is,

Then, fit a quadratic model to data.

X2 = X1.copy()

X2.insert(2, 'LSTAT^2', X2['LSTAT']**2)

beta4 = cp.Variable(3)

loss4 = cp.sum_squares(y.values-X2.values @ beta4)

prob4 = cp.Problem(cp.Minimize(loss4))

prob4.solve()

yhat4 = X2.values@beta4.value

grader.check("q4a")

Visualize quadratic fit:

fig, ax = plt.subplots(figsize=(10, 7))

sns.scatterplot(x='LSTAT', y='MEDV', data=housing, ax = ax, label='Data')

sns.scatterplot(housing['LSTAT'], yhat4, label='Fit', ax = ax)

plt.legend()

plt.show()

---

To double-check your work, the cell below will rerun all of the autograder tests.

grader.check_all()

## Submission

Make sure you have run all cells in your notebook in order before running the cell below, so that all images/graphs appear in the output. The cell below will generate a zip file for you to submit. **Please save before exporting!**

# Save your notebook first, then run this cell to export your submission.

grader.export()
Similar Samples
Explore our curated samples at ProgrammingHomeworkHelp.com to witness our expertise in tackling diverse programming assignments. From introductory exercises to advanced projects, our examples demonstrate clear problem-solving approaches in various languages. These samples are designed to inspire and guide you in mastering programming concepts effectively.
Python
Python
Python
Python
Python
Python
Python
Python
Python
Python
Python
Python
Python
Python
Python
Python
Python
Python
Python
Python