Using Pandas in Python to Analyze Stock Data: Mean Values, Minimums, and Trading Volumes

- Question:
- Solution:
Welcome to our detailed sample solution for a data analysis assignment, designed to showcase our Python assignment help services. In this example, we delve into analyzing stock data from a CSV file using Python and Pandas. Our solution covers various tasks, including data extraction, aggregation, and statistical calculations. By examining the data and answering specific questions about stock performance, we demonstrate our expertise in handling complex data challenges with precision and clarity. This example also highlights the quality of our help with programming assignments, providing you with a clear understanding of how we tackle intricate programming tasks.
Question:
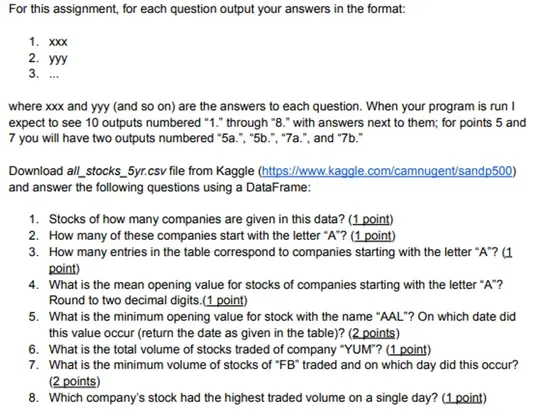
Solution:
states <- 3
	N<-10^4
	initial_probabilities <- c(0.3, 0.5, 0.2)
	# computing the transition matrix
	transition_matrix <-c(0.1 ,0.7, 0.2,
	0.3, 0.3, 0.4,
	0.2, 0.5, 0.3)
	transition_matrix
	transition_matrix_p <-matrix(transition_matrix, ncol=states, nrow=states, byrow=TRUE)
	# the confidence intervals
	Ntransitions<-matrix(0, states, states)
	for(n in 1:N) {
	Ntransitions[X[n],X[n+1]]<-Ntransitions[X[n],X[n+1]]+1
	Ni<-rowSums(Ntransitions)
	Ni<-rowSums(Ntransitions)
	NiInv<-1/Ni
	NiInv[NiInv==Inf]<-0
	mle<-diag(NiInv)%*%Ntransitions
	error<-qnorm(1-a/2)*sqrt(diag(NiInv)%*%(mle*(matrix(1,states,states)-mle)))
	CI_inf<-mle-error
	CI_inf[CI_inf<0]<-0    # constraint p_ij>=0
	CI_sup<-mle+error
	CI_sup[CI_sup>1]<-1    # constraint p_ij<=1
	list(mle=mle, error=error, CI_inf=CI_inf,
	CI_sup=CI_sup, NiInv=NiInv)
	}
	est<-mleMC(X, states)
	confidence_intervals<-data.frame(i=factor(rep(1:states, times=states)),
	j=factor(rep(1:s, each=states)),
	mle=as.vector(est$mle),
	CI_inf=as.vector(est$CI_inf),
	CI_sup=as.vector(est$CI_sup))
	ggplot(confidence_intervals) +
	geom_segment(aes(x=1, xend=1, y=CI_inf, yend=CI_sup, col=i)) +
	geom_point(aes(x=1, y=mle, col=i)) +
	ylab("Probability") +
	xlab("") +
	labs(title="Estimated Transition Probabilities
	with 95% Confidence Intervals ") +
	facet_grid(i~j) +
	guides(col=FALSE) +
	theme_bw() +
	theme(axis.text.x=element_blank(),
	axis.ticks.x=element_blank())
Similar Samples
We offer a wide range of programming assignment services tailored to meet student needs. Explore our extensive collection of sample programming questions, designed to provide clear insights and guidance. These samples are perfect for enhancing your understanding and mastering programming concepts effectively.
C++
C
Database
Embedded System
Python
C++
Data Structures and Algorithms
Python
Python
Python
Python
Python
Python
Python
Python
Python
Python
Python
Python
Python