Instructions
Objective
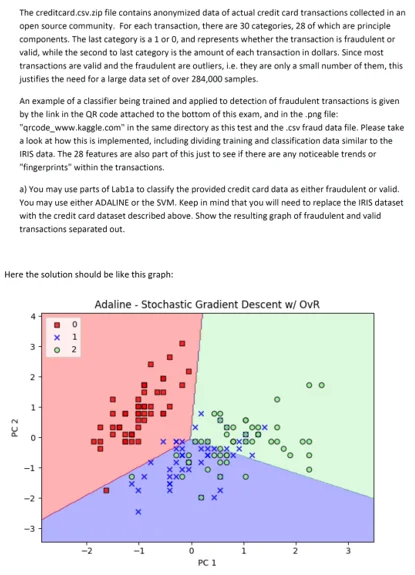
Write a python assignment to implement stochastic gradient descent.
Requirements and Specifications

Source Code
!pip install --upgrade --no-cache-dir gdown

## Download Dataset from drive link

!gdown --id 1H7ONGAS2hZgOBIq8csIdjjpNGVs4aWPL

import pandas as pd

import numpy as np

from sklearn import preprocessing

from sklearn.metrics import confusion_matrix

from sklearn import svm

import seaborn

import matplotlib.pyplot as plt

from sklearn.metrics import plot_confusion_matrix

from sklearn.neighbors import KNeighborsClassifier

from sklearn.preprocessing import MinMaxScaler

from sklearn.metrics import accuracy_score

from sklearn.ensemble import RandomForestClassifier

from sklearn.decomposition import PCA

## Load Dataset

df = pd.read_csv('creditcard.csv')

df = df.astype({col: 'float32' for col in df.select_dtypes('float64').columns})

df = df.astype({col: 'int32' for col in df.select_dtypes('int64').columns})

df.head()

## Normalize Dataset

scaler = MinMaxScaler(feature_range=(0, 1))

normed = scaler.fit_transform(df)

df_normed = pd.DataFrame(data=normed, columns=df.columns)

df_normed.head()

## Describe

df.describe()

## Check correlation between variables

plt.figure()

seaborn.heatmap(df.corr(), cmap="YlGnBu") # Displaying the Heatmap

#seaborn.set(font_scale=2,style='white')

plt.title('Heatmap correlation')

plt.show()

# Balance

df_1 = df[df['Class'] == 1]

df_0 = df[df['Class'] == 0].iloc[:len(df_1),:]

df = df_0.append(df_1, ignore_index = True)

df = df.sample(frac=1)

scaler = MinMaxScaler(feature_range=(0, 1))

normed = scaler.fit_transform(df)

df_normed = pd.DataFrame(data=normed, columns=df.columns)

df_normed.head()

## Split into train and test

train = df_normed.sample(frac=0.7)

val = df_normed.loc[~df_normed.index.isin(train.index)]

train.reset_index(drop=True, inplace=True)

val.reset_index(drop=True, inplace=True)

## Split data into X and y

y_train = train['Class']

X_train = train.drop(columns = ['Time', 'Amount', 'Class'])

y_val = val['Class']

X_val = val.drop(columns = ['Time', 'Amount', 'Class'])

## PCA

pca = PCA(n_components = 2)

pca.fit(X_train)

X_train = pca.transform(X_train)

pca = PCA(n_components = 2)

pca.fit(X_val)

X_val = pca.transform(X_val)

## Create Model

model = svm.SVC(kernel = 'linear',C=1.0)

model.fit(X_train, y_train)

## Measure Accuracy

y_pred = model.predict(X_val)

model_acc = accuracy_score(y_val, y_pred)

print(f"The accuracy of the model is: {model_acc}")

## Confusion matrix

fig, axes = plt.subplots(nrows = 1, ncols = 2, figsize=(8,8))

plot_confusion_matrix(model, X_train, y_train, ax = axes[0])

plot_confusion_matrix(model, X_val, y_val, ax = axes[1])

plt.show()

## Display clustering

x_min, x_max = X_train[:, 0].min() - 1, X_train[:, 0].max() + 1

y_min, y_max = X_train[:, 1].min() - 1, X_train[:, 1].max() + 1

xx, yy = np.meshgrid(np.arange(x_min, x_max, 0.02),

                     np.arange(y_min, y_max, 0.02))

plt.figure(figsize=(8,8))

ypred = model.predict(np.c_[xx.ravel(), yy.ravel()])

ypred = ypred.reshape(xx.shape)

plt.contourf(xx, yy, ypred, cmap = plt.cm.coolwarm, alpha = 0.8)

idx = np.where(y_train == 1)[0]

plt.scatter(X_train[idx,0], X_train[idx,1], c = 'red',cmap = plt.cm.coolwarm, marker='o',edgecolors='black', label = '1')

idx = np.where(y_train == 0)[0]

plt.scatter(X_train[idx,0], X_train[idx,1], c = 'blue',cmap = plt.cm.coolwarm, marker='s',edgecolors='black', label = '0')

plt.legend()

plt.legend()

# Part 2) Now cluster for each pair of consecutive features

fig, ax = plt.subplots(nrows = 2, ncols = 14, figsize=(30,10))

j = 0

k = 0

for i in range(27):

  X_train = train.drop(columns = ['Time', 'Amount', 'Class']).iloc[:,i:i+2]

  X_val = val.drop(columns = ['Time', 'Amount', 'Class']).iloc[:,i:i+2]

  model2 = KNeighborsClassifier(n_neighbors=2)

  model2.fit(X_train,y_train)

  y_min, y_max = X_val.values[:, 1].min() - 1, X_val.values[:, 1].max() + 1

  x_min, x_max = X_val.values[:, 0].min() - 1, X_val.values[:, 0].max() + 1

  xx, yy = np.meshgrid(np.arange(x_min, x_max, 0.02),

                      np.arange(y_min, y_max, 0.02))

  ypred = model2.predict(np.c_[xx.ravel(), yy.ravel()])

  ypred = ypred.reshape(xx.shape)

  ax[j,k].contourf(xx, yy, ypred, cmap = plt.cm.coolwarm, alpha = 0.8)

  idx = np.where(y_val == 1)[0]

  ax[j,k].scatter(X_val.values[idx,0], X_val.values[idx,1], c = 'red',cmap = plt.cm.coolwarm, marker='o',edgecolors='black', label = '1')

  idx = np.where(y_val == 0)[0]

  ax[j,k].scatter(X_val.values[idx,0], X_val.values[idx,1], c = 'blue',cmap = plt.cm.coolwarm, marker='s',edgecolors='black', label = '0')

  ax[j,k].axis('off')

  ax[j,k].legend()

  ax[j,k].set_title(f'V{i+1} vs. V{i+2}')

  k+=1

  if k%14 == 0:

    j += 1

    k = 0

plt.show()

Now, we see that since we only have two classes, the best number of clusters/neighbors to select is 2. We see how each pair of variables is clustered in the multi-plot figure shown above.

# Random Forest

fig, ax = plt.subplots(nrows = 2, ncols = 14, figsize=(30,10))

j = 0

k = 0

for i in range(27):

  X_train = train.drop(columns = ['Time', 'Amount', 'Class']).iloc[:,i:i+2]

  X_val = val.drop(columns = ['Time', 'Amount', 'Class']).iloc[:,i:i+2]

  model3 = RandomForestClassifier(max_depth=2, random_state=0)

  model3.fit(X_train,y_train)

  y_min, y_max = X_val.values[:, 1].min() - 1, X_val.values[:, 1].max() + 1

  x_min, x_max = X_val.values[:, 0].min() - 1, X_val.values[:, 0].max() + 1

  xx, yy = np.meshgrid(np.arange(x_min, x_max, 0.02),

                      np.arange(y_min, y_max, 0.02))

  ypred = model3.predict(np.c_[xx.ravel(), yy.ravel()])

  ypred = ypred.reshape(xx.shape)

  ax[j,k].contourf(xx, yy, ypred, cmap = plt.cm.coolwarm, alpha = 0.8)

  idx = np.where(y_val == 1)[0]

  ax[j,k].scatter(X_val.values[idx,0], X_val.values[idx,1], c = 'red',cmap = plt.cm.coolwarm, marker='o',edgecolors='black', label = '1')

  idx = np.where(y_val == 0)[0]

  ax[j,k].scatter(X_val.values[idx,0], X_val.values[idx,1], c = 'blue',cmap = plt.cm.coolwarm, marker='s',edgecolors='black', label = '0')

  ax[j,k].axis('off')

  ax[j,k].legend()

  ax[j,k].set_title(f'V{i+1} vs. V{i+2}')

  k+=1

  if k%14 == 0:

    j += 1

    k = 0

plt.show()
Similar Samples
Discover a wide range of programming homework samples at Programming Homework Help. Our examples showcase expert solutions to complex coding challenges, helping you understand various programming concepts and improve your coding skills. Get inspired and learn how to tackle your assignments effectively!
Python
Python
Python
Python
Python
Python
Python
Python
Python
Python
Python
Python
Python
Python
Python
Python
Python
Python
Python
Python
.webp)