Python Program to Predict Stock Prices Assignment Solution
.svg)
- Instructions
- Objective
- Requirements and Specifications
Instructions
Objective
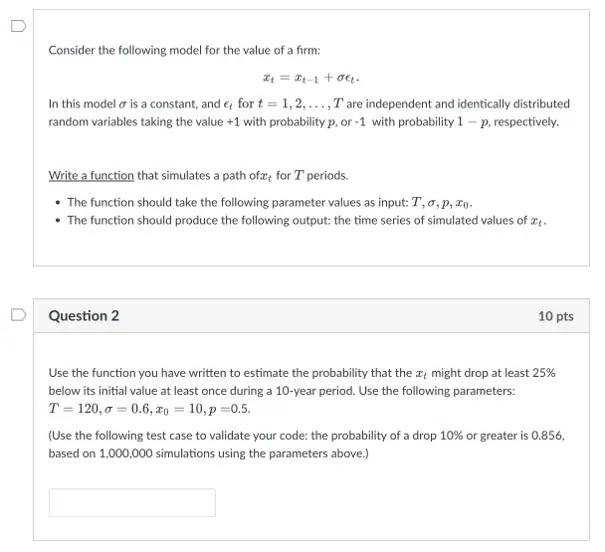
Write a python assignment program to predict stock prices.
Requirements and Specifications
Source Code
from functions import *
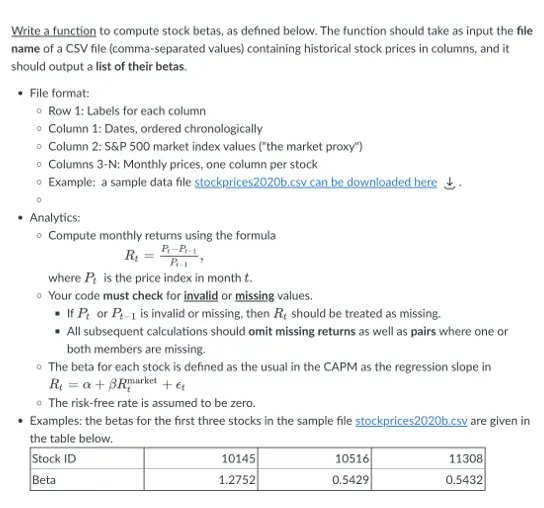
### beta calculations
get_beta('data.csv')
### simulation function
data=simulate(120,0.6,0.5,10)
data
### Calculating probability
c=0
for i in range(10000):
data=simulate(T=120,alpha=0.6,p=0.5,x0=10)
drop=(data[-1]-data[0])/data[0]
if drop<=-0.1:
c+=1
c/10000
c=0
for i in range(10000):
data=simulate(T=120,alpha=0.6,p=0.5,x0=10)
drop=(data[-1]-data[0])/data[0]
if drop<=-0.25:
c+=1
c/10000
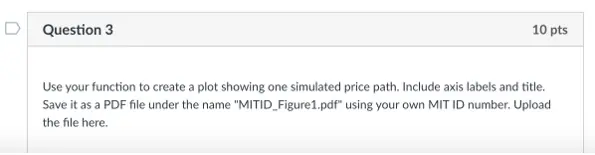
### Visualization
data=simulate(120,0.6,0.5,10)
plt.figure(figsize=(10,8))
plt.plot(data)
plt.grid()
plt.xlabel('time steps',fontsize=20)
plt.ylabel('price',fontsize=20)
plt.title('stock price simulation',fontsize=20)
plt.ylim(0,20)
plt.savefig('MITID_Figure1.pdf')
plt.show()
Similar Samples
Explore our samples at ProgrammingHomeworkHelp.com to witness excellence in action. Our curated examples showcase the breadth of our expertise across various programming languages and disciplines. Whether you need assistance with Java, Python, or data visualization projects in MATLAB, our samples demonstrate our commitment to quality and precision. Let our work speak for itself as you discover how we can elevate your programming assignments to new heights of success.
Python
Python
Python
Python
Python
Python
Python
Python
Python
Python
Python
Python
Python
Python
Python
Python
Python
Python
Python
Python